Consolidated Financial Highlights
Consolidated Statements of profit
Net sales(Millions of yen)
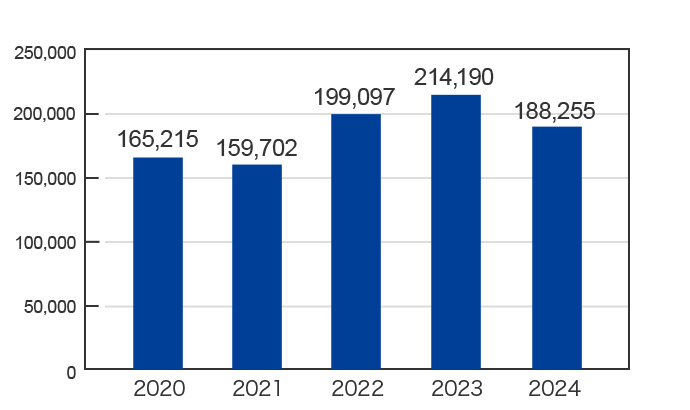
| End of Mar. 2020 | End of Mar. 2021 | End of Mar. 2022 | End of Mar. 2023 | End of Mar. 2024 | |
|---|---|---|---|---|---|
| Net sales | 165,215 | 159,702 | 199,097 | 214,190 | 188,255 |
Operating profit(Millions of yen),Operating margin(%)
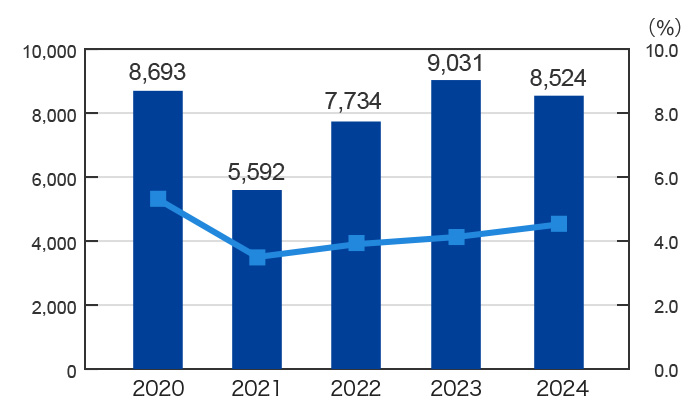
| End of Mar. 2020 | End of Mar. 2021 | End of Mar. 2022 | End of Mar. 2023 | End of Mar. 2024 | |
|---|---|---|---|---|---|
| Operating profit | 8,693 | 5,592 | 7,734 | 9,031 | 8,524 |
| Operating margin | 5.3% | 3.5% | 3.9% | 4.2% | 4.5% |
Net profit(Millions of yen),Return on sales(%)
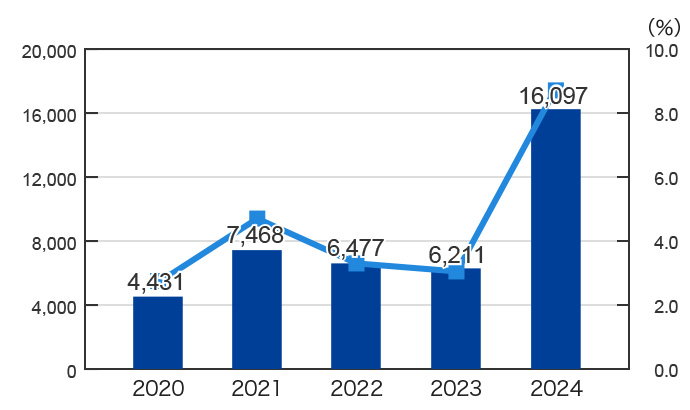
| End of Mar. 2020 | End of Mar. 2021 | End of Mar. 2022 | End of Mar. 2023 | End of Mar. 2024 | |
|---|---|---|---|---|---|
| Net profit | 4,431 | 7,468 | 6,477 | 6,211 | 16,097 |
| Return on sales | 2.7% | 4.7% | 3.3% | 2.9% | 8.6% |
Assets
Total Assets(Millions of yen) , Equity ratio(%)
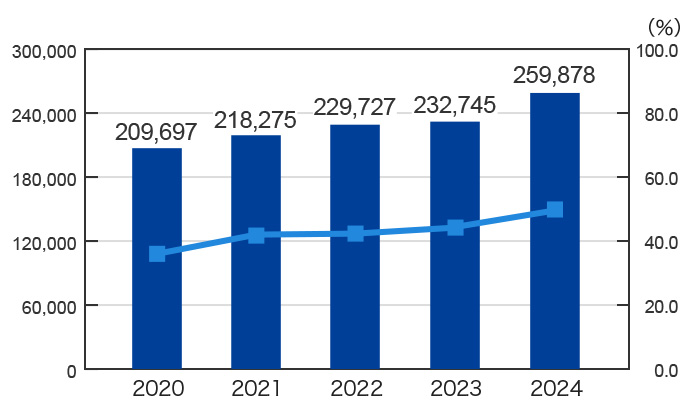
| End of Mar. 2020 | End of Mar. 2021 | End of Mar. 2022 | End of Mar. 2023 | End of Mar. 2024 | |
|---|---|---|---|---|---|
| Total Assets | 218,275 | 229,727 | 232,745 | 215,368 | 259,878 |
| Equity ratio | 36.0% | 42.0% | 42.3% | 44.2% | 50.0% |
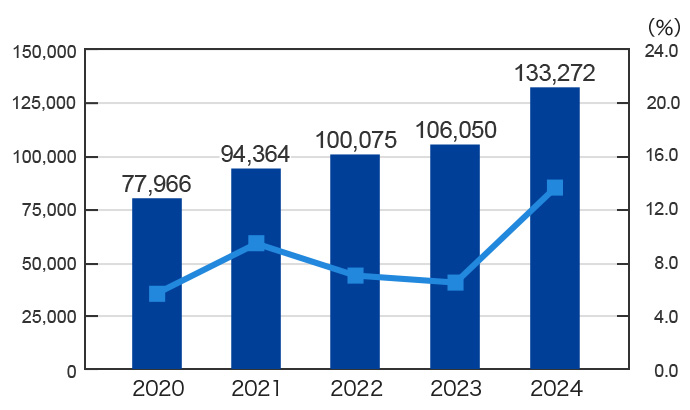
Net assets(Millions of yen),Return on equity(%)
| End of Mar. 2020 | End of Mar. 2021 | End of Mar. 2022 | End of Mar. 2023 | End of Mar. 2024 | |
|---|---|---|---|---|---|
| Net assets | 77,966 | 94,364 | 100,075 | 106,050 | 133,272 |
| Return on equity | 5.8% | 8.9% | 6.9% | 6.2% | 13.8% |
Segment Performance
Segment Performance / Net Sales
(Unit: Million yen. Rounded down to million yen)
| Net Sales | FY2019 (Results) |
FY2020 (Results) |
FY2021 (Results) |
FY2022 (Results) |
FY2023 (Results) |
|---|---|---|---|---|---|
| Machinery | 82,691 | 68,635 | 76,938 | 81,658 | 82,085 |
| Industrial Machinery | 23,237 | 16,682 | 17,723 | 17,943 | 15,548 |
| Rock Drill Machinery | 27,663 | 24,149 | 30,910 | 35,752 | 38,682 |
| UNIC Machinery | 31,791 | 27,804 | 28,305 | 27,961 | 27,853 |
| Materials | 79,366 | 88,203 | 118,163 | 126,804 | 100,388 |
| Metals | 67,149 | 76,094 | 102,995 | 111,424 | 84,712 |
| Electronics | 5,506 | 5,741 | 7,271 | 6,926 | 6,766 |
| Chemicals | 6,710 | 6,367 | 7,896 | 8,454 | 8,908 |
| Real Estate | 2,386 | 2,107 | 2,115 | 2,056 | 1,873 |
| Other | 771 | 755 | 1,879 | 3,671 | 3,908 |
| [Total] | 165,215 | 159,702 | 199,097 | 214,190 | 188,255 |
Operating profit Trends by Segment
(Unit: Million yen. Rounded down to million yen)
| Operating profit | FY2019 (Results) |
FY2020 (Results) |
FY2021 (Results) |
FY2022 (Results) |
FY2023 (Results) |
|---|---|---|---|---|---|
| Machinery | 7,343 | 3,968 | 4,679 | 6,093 | 5,696 |
| (*Composition ratio) | (83%) | (69%) | (60%) | (66%) | (64%) |
| Industrial Machinery | 3,208 | 2,113 | 1,396 | 1,515 | 389 |
| Rock Drill Machinery | 142 | △1,324 | 1,117 | 3,030 | 4,148 |
| UNIC Machinery | 3,992 | 3,180 | 2,165 | 1,547 | 1,158 |
| Materials | 776 | 1,040 | 2,349 | 2,309 | 2,765 |
| (*Composition ratio) | (9%) | (18%) | (30%) | (25%) | (31%) |
| Metals | 301 | 499 | 940 | 1,276 | 1,945 |
| Electronics | △35 | 161 | 666 | 500 | 212 |
| Chemicals | 510 | 380 | 743 | 532 | 608 |
| Real Estate | 735 | 736 | 743 | 835 | 470 |
| (*Composition ratio) | (8%) | (13%) | (10%) | (9%) | (5%) |
| Other | △94 | △82 | 17 | △133 | △293 |
| (Sub Total) | 8,761 | 5,663 | 7,789 | 9,104 | 8,638 |
| Adjustment | △68 | △71 | △54 | △73 | △114 |
| [Total] | 8,693 | 5,592 | 7,734 | 9,031 | 8,524 |
